Enscape for Archicad
Comparing Enscape Impact and IES VE
This page compares Enscape Impact and IES VE.
Last updated 1 September 2026
This page compares Enscape Impact and IES VE.
Enscape Impact & IES VE
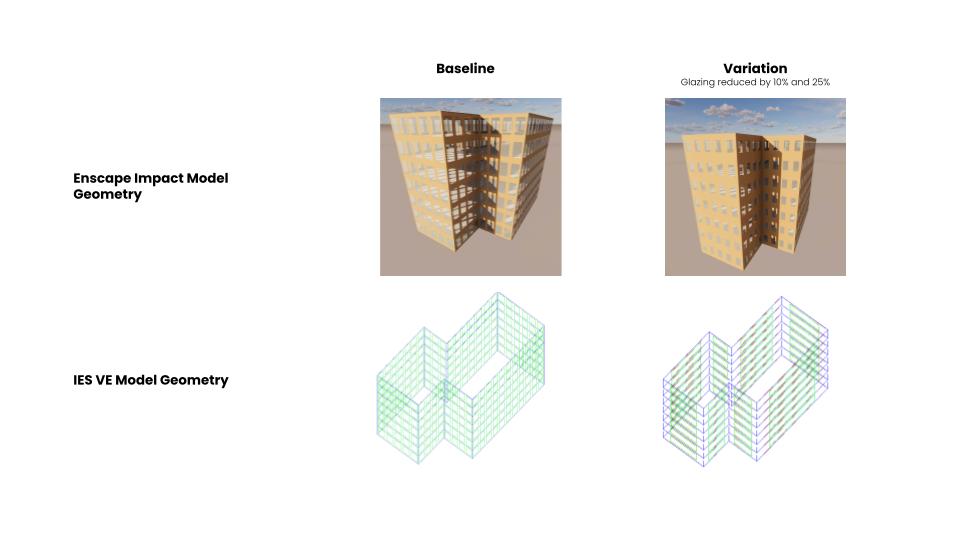
Baseline and Variation
The Variations with respect to glazing changes of 10% and 25% show a very similar improvement between both software applications.
Glazing changes comparison:
Enscape Impact Model | IES VE Model | Variance |
|---|
Enscape Impact Model | IES VE Model | Variance | |||
|---|---|---|---|---|---|
Total Energy (MWh) | % Difference | Total Energy (MWh) | % Difference | ||
Baseline Simulation Results | 520 | - | 592 | - | 12% |
Variation 1, glazing reduced by 10% | 487 | 6.3% | 542 | 8.5% | 2.2% |
Variation 1, glazing reduced by 25% | 440 | 15.4% | 493 | 16.7% | 1.3% |
Further testing is currently being carried out, across more model archetypes and locations and also design changes. These test results will be turned into a white paper and published with the release.
Overall, there is a variance of 12% between Enscape Impact & IES VE results.
Overall Results:
Enscape Impact Model | IES VE Model | Variance |
|---|
Enscape Impact Model | IES VE Model | Variance | |
|---|---|---|---|
Baseline Simulation Results | Total Energy (MWh) | Total Energy (MWh) | |
Total Energy (MWh) | 520 | 592 | 12% |
Heating (MWh) | 134 | 260 | 48% |
Cooling (MWh) | 33 | 28 | 18% |
Hot Water (MWh) | 32 | 32 | 0% |
Lighting (MWh) | 167 | 155 | 8% |
Equipment (MWh) | 154 | 116 | 33% |
EUI (kWh/m2) | 105 | 119 | 12% |
Baseline is within a good tolerance between Impact and the IES VE; this is attributed to known factors such as how the geometry is modeled in Impact and differences in the default datasets applied to the model, both of which will be improved over time.
Geometry Comparison:
Enscape Impact Model | IES VE Model | Variance |
|---|
Enscape Impact Model | IES VE Model | Variance | |
|---|---|---|---|
Spaces (m2) | 33 | 40 | 21.2% |
Volume (m3) | 7,247 | 6,699 | 7.6% |
Ground floor area (m2) | 768 | 739 | 3.7% |
Roof area (m2) | 1,315 | 766 | 41.7% |
Internal Floor Area (m2) | 2,167 | 2,167 | 0.0% |
Ceiling area (m2) | 2,236 | 2,167 | 3.1% |
Total floor area (m2) | 2,935 | 2,906 | 1.0% |
External wall area (m2) | 1,137 | 1,278 | 12.4% |
External door area (m2) | - | 3.40 | - |
External glazing area (m2) | 95 | 123 | 30.5% |
While there are discrepancies in the results, the results clearly show that the impact of the change is in the right direction. As such, the user will have enough information to know if the change they are making has a positive or negative impact and by approximately how much of an impact, e.g. 10%, 15%, 20% etc.
Impact runs on the IES Apache technology. If you want to learn more, check out the Enscape Impact Video Tutorial.
Impact 4.1 and 4.2 Comparisons

Click on the image to see it in full screen
Impact 4.5 and 4.6 Comparisons

Click on image to enlarge or visit
this link
to explore the full comparison.
To further understand the accuracy of results generated with Enscape Impact, IES conducted a test, comparing project results from Impact 4.1 and IES VE. This article will give us a quick overview of those results. A seven-story office building in London, UK was used as a base model for the comparison.