Enscape
How Impact Works
This page explains Enscape Impact workflows and settings.
Last updated 1 September 2026
This page explains Enscape Impact workflows and settings.
Settings
Location – If your CAD project is geolocated, that location shows up here automatically. If there is no information, use the search bar to select your desired location.

Enscape Impact Location
Building Type – Choose a building type. If no type corresponds to your specific building, choose the closest option.
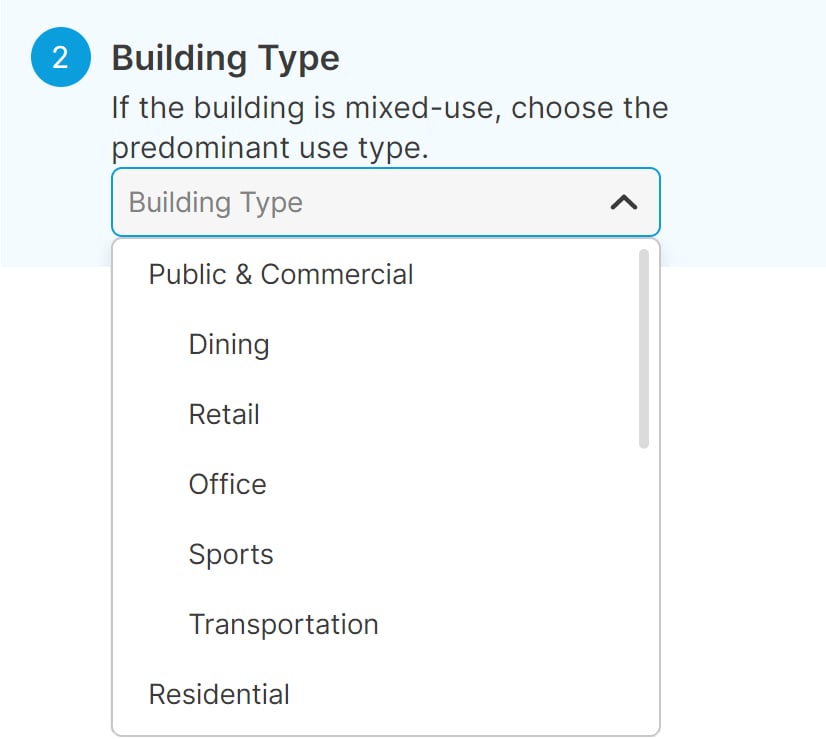
Enscape Impact Building Type
Build Year – Select the year when the building was constructed.
Renovation Year – Add the year when the building was last renovated. This step is optional.

Enscape Impact Year
Settings – Click the gear icon on the Dashboard to access and adjust the settings at any time.
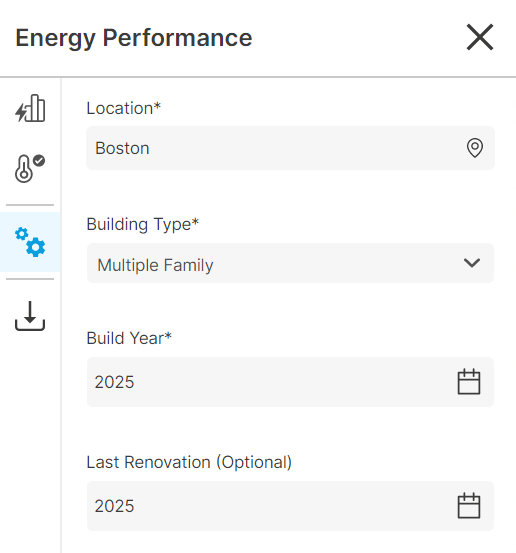
Enscape Impact Dashboard Settings
Dashboard
The Impact Analysis Dashboard provides analysis based on your project design and input. The project must be set to its True North. The solar impact is calculated based on the true orientation of the building and not the sun settings saved in Enscape.
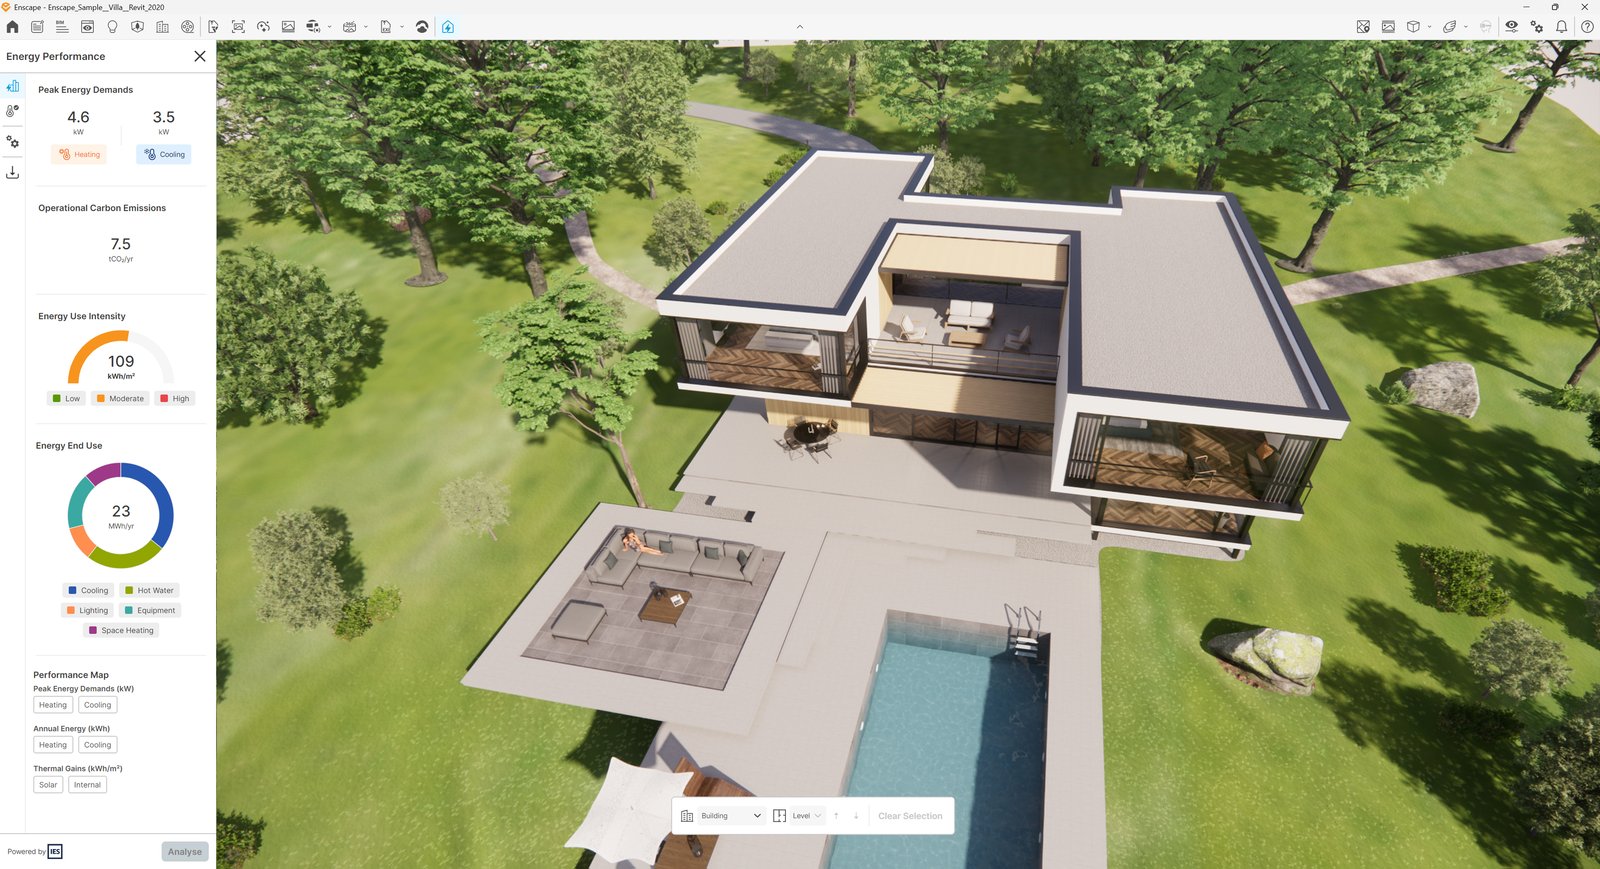
Impact Analysis Dashboard
Energy Performance
The Energy Performance dashboard provides a quick, high-level overview of your design's environmental footprint and system demands.
Peak Energy Demands – Reports the maximum power capacity required by the building's climate control systems annually. This is a sum of heating energy, cooling energy, internal gains, and solar gains. It determines the capacity needed for systems such as HVAC (Heating, Ventilation, and Air Conditioning) to handle these peak demands efficiently.
Heating – Displays peak heating load in kilowatts (kW). Accompanied by an orange sun icon.
Cooling – Displays peak cooling load in kilowatts (kW). Accompanied by a blue snowflake icon.
Operational Carbon Emissions – Calculates the annual carbon dioxide equivalent resulting from the building's operational energy consumption, measured in tons of CO₂ per year (tCO₂/yr). Essential for keeping projects aligned with regional or global decarbonization goals (such as the AIA 2030 Commitment or RIBA targets).
Energy Use Intensity – Quantifies the building's total annual energy consumption relative to its floor area.
Energy End Use – Provides a comprehensive breakdown of annual energy consumption distributed across major building systems.
Performance Map – Visualizes the building analysis in the project model. Select the map you want to apply. This switches the Enscape view mode to white and applies colors to your model reflecting these performance maps.
Peak Energy Demands (kW) – Toggle between Heating and Cooling visualization.
Annual Energy (kWh) – Toggle between Heating and Cooling distribution.
Thermal Gains (kWh/m²) – Toggle between Solar (exterior radiation impacts on glazing/facades) and Internal (heat generated by occupants, equipment, and lighting) loads.
Heating Energy, Cooling Energy for Peak Energy Demands, and Annual Energy, as well as Solar Energy under Thermal Gains. The quick comparison represents these visual modes with their color scales. All closed spaces are calculated, and complete rooms are visualized with transparency.
Impact runs on the IES Apache technology. The weather data used for building location is extracted from Ashrae Weather Data Center. For more information, see the Enscape Impact Video Tutorial.
Performance Map Example


Enscape Impact Dashboard Energy Performance
These two images compare varying results of the same model. One is located in Boston and the other in Los Angeles. See the different energy consumption displayed in the Dashboard.

Location = Boston
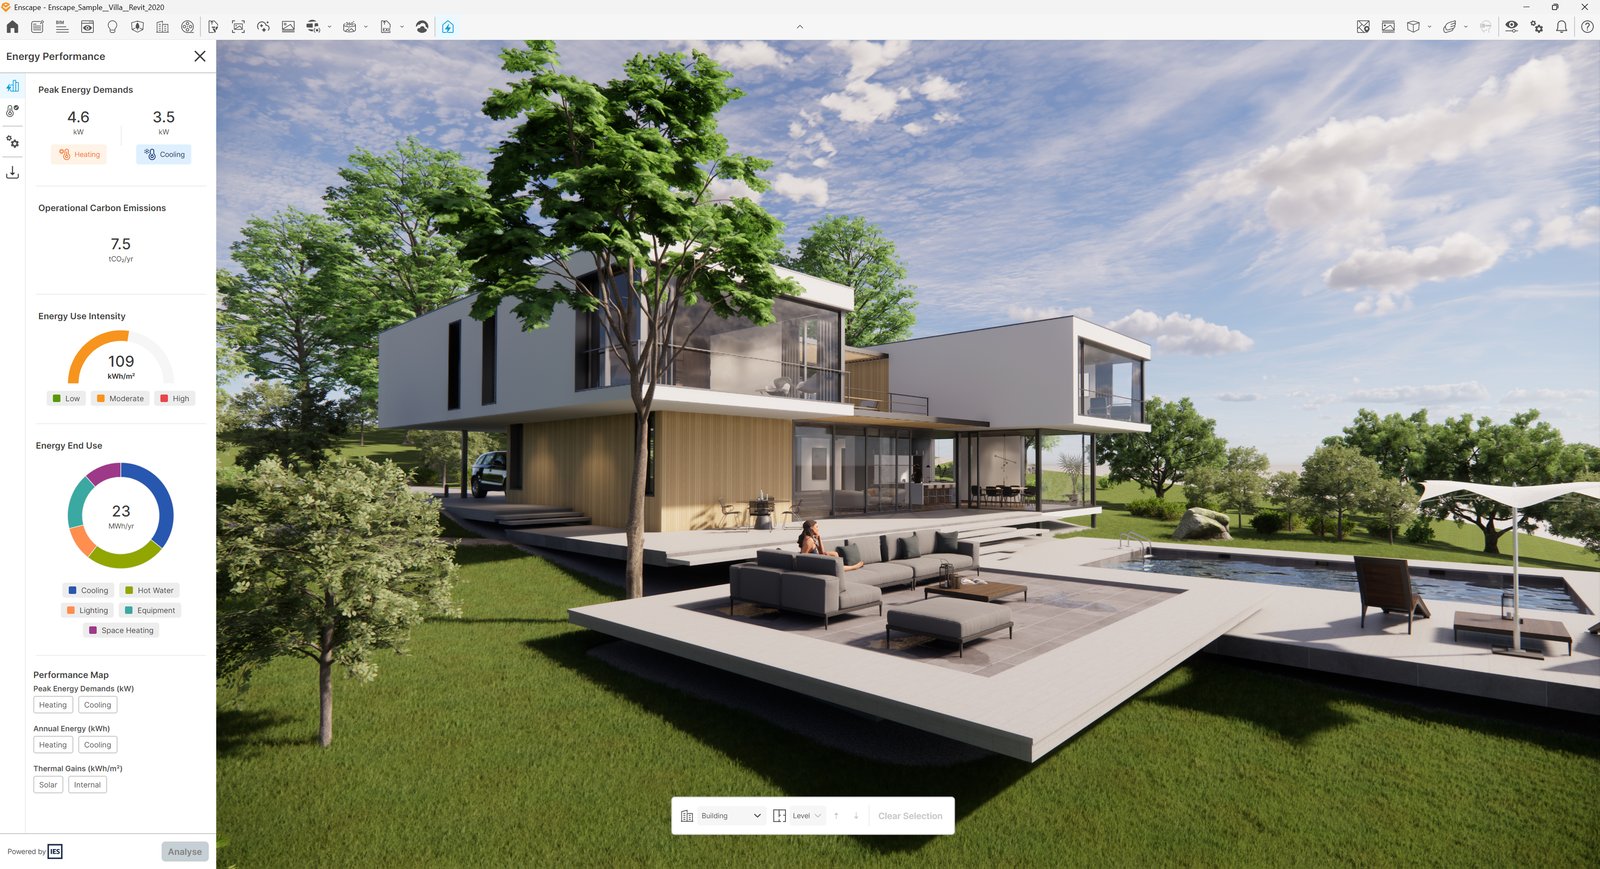
Location = Los Angeles