Enscape
Thermal Comfort Analysis
This page describes the Impact Thermal Comfort Analysis tool in Enscape
Last updated 1 September 2026
This page describes the Impact Thermal Comfort Analysis tool in Enscape
Understanding how comfortable a space feels for its occupants is a key part of designing great architecture. With Thermal Comfort in Enscape Impact, you can evaluate how your design performs without needing complex simulation tools. Impact visualizes comfort levels directly in your 3D model, highlighting which areas feel pleasant year-round and which might become too hot or too cold.
- Start Enscape Impact
Open your project and start Impact by clicking Enscape Impact on the toolbar or using the shortcut N. - Enter Project Data
On first use, the wizard guides you to set up:- Project location (can be auto-filled if already defined)
- Building type
- Construction year and last renovation year (if applicable)
- Run Geometry Detection
Click Analyse to detect building geometry and run the initial Energy Performance analysis. Geometry detection takes only a moment - once complete, the Thermal Comfort menu becomes available:

Thermal Comfort Button

Energy Performance panel with project details and Analyze button.
Assign Room Type
Thermal comfort results depend on how rooms are used. After geometry detection, all detected rooms are listed in the Thermal Comfort panel.
Review the Room List
Rooms are grouped by building and floor.
Each room is automatically named and highlighted in the renderer view when selected.
Room highlight in the Viewport
Assign Room Types
Room types define how spaces are occupied and conditioned. Use the dropdown menu to choose from predefined room types.
Recommended options appear based on your selected building type, but you can search and assign any type. You can assign types individually or in bulk – per floor, building, or the entire project.
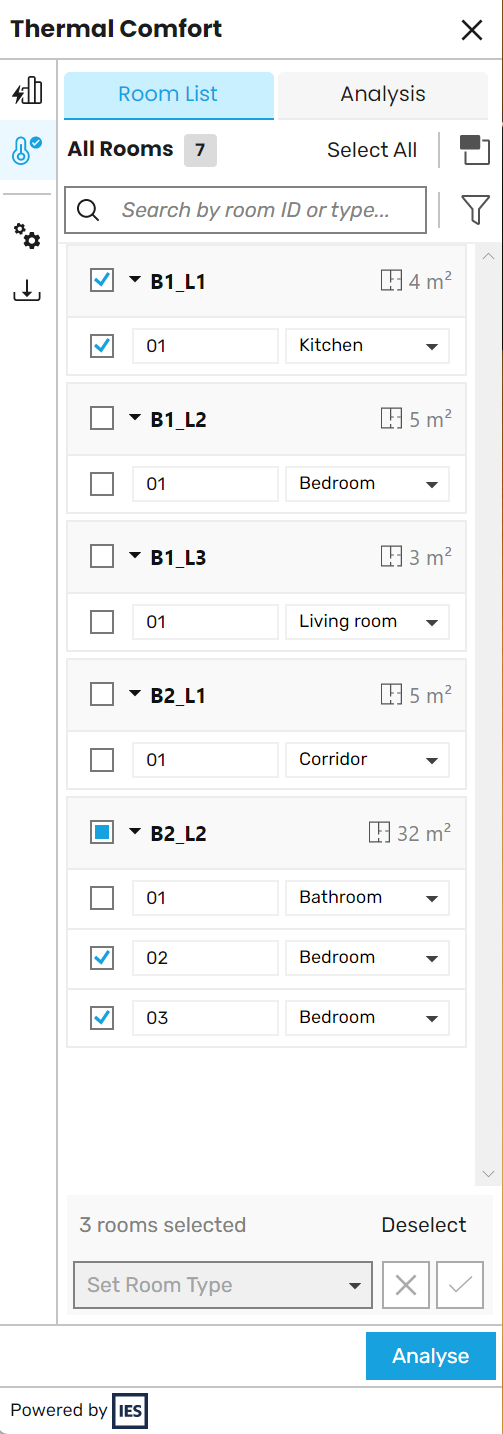
Thermal Comfort - Room assigning
Save and Edit
Assigned types are saved automatically. Rooms can be renamed and filtered by type and status. If geometry changes (e.g., walls are removed or rooms are split), you need to run room detection again.

Thermal Comfort - Room Adjustments
Running the Thermal Comfort Analysis
Once all room types are assigned:
- Click Analyse again to run the Thermal Comfort calculation.
- Depending on project size, this may take a few minutes.
- Closing the Enscape Impact panel cancels the analysis. You can also manually cancel if changes are needed.
The simulation uses the Predicted Mean Vote (PMV) methodology - an international standard that estimates how occupants feel based on temperature, humidity, and air movement.
Understanding Comfort Ranges
Comfort thresholds vary slightly by climate zone. For conditioned spaces, the following PMV ranges are considered comfortable. The analysis checks the frequency each space stays within this comfort range throughout the year.
Climate Zone | PMV Range |
Climate Zone | PMV Range |
Extremely Hot | 0 to +1 |
Very Hot | –0.25 to +0.7 |
Hot | –0.25 to +0.7 |
Warm | –0.5 to +0.5 |
Mixed | –0.5 to +0.5 |
Cool | –0.5 to +0.5 |
Cold | –0.5 to +0.5 |
Very Cold | –0.7 to +0.5 |
Arctic | –0.7 to +0.5 |
Viewing Results & Insights
When the analysis is complete, the Thermal Comfort Dashboard opens with several views:
Overall Building Performance
The pie chart shows the percentage of comfortable rooms on an annual basis.
You can filter by building using the dropdown at the top.

Yearly Overview
Monthly Overview
The bar chart shows which months pose the most comfort challenges - for example, when spaces overheat in summer or feel too cool in winter.

Thermal Comfort Analysis - Monthly Bar Chart
Room-Level Analysis
Click View All Rooms to explore comfort levels per room. The analysis contains information about:
- The percentage of comfortable time per room on an annual basis.
- Pass/fail indicator – rooms pass if at least 99% of occupied hours stay within the comfort range.
Use the filter to quickly focus on failing rooms and spot areas that may need attention.
Visualizing Comfort in the Model
Use Performance Maps to see how comfort varies spatially:
Choose between Annual view or Extreme Days (the hottest and coldest days based on your project location). Colors indicate comfort performance:
Color | Comfort Level | Description |
Color | Comfort Level | Description |
🟩 Green | Excellent | >99% of time comfortable |
🟨 Yellow | Acceptable | 75–99% |
🟧 Orange | Underperforming | 50–74% |
🟥 Red | Critical | <50% |

Thermal Comfort - Performance Map
Improving Your Design
Thermal Comfort insights help guide design improvements in your model:
- Adjust glazing ratios to prevent overheating.
- Reconsider room orientation. For instance, move a living room to a sunny south-facade for warmth and a kitchen to the north to reduce solar gain.
- Experiment with window size or placement to enhance comfort balance.
Every small adjustment can contribute to a more pleasant, energy-efficient building – without ever leaving your 3D workflow.
Bonus Benefit: Better Energy Accuracy
Assigning room types and running the comfort analysis also refines your Energy Performance results.
Each room type carries unique occupancy patterns and internal loads, improving the accuracy of your overall simulation.
Troubleshooting
- Missing Rooms: Ensure all spaces are enclosed by walls, floors, and ceilings.
- Outdated Analysis: If you change geometry or materials, re-run the analysis.
- Slow Results: Larger projects naturally take longer; start by testing smaller models or dividing buildings into separate views to get familiar with the workflow.