Enscape
Understanding Outputs
This page provides information about the outputs in Enscape Impact.
Last updated 28 May 2026
This page provides information about the outputs in Enscape Impact.
Understanding Room Detection
1. Room Detection
Room detection in Enscape Impact identifies enclosed spaces (rooms) in your CAD model. It creates simplified room shells (boxes) for each detected room and runs energy performance analysis based on those models. Different project views can yield different results because the analysis is performed on the visible geometry in the selected view.
2. Room Standards
A room is any enclosed space that is fully surrounded by geometry. Rooms must have dimensions greater than 35 cm in height, width, and depth to be considered. Large openings (over 35-70 cm) in a room prevent it from being detected as enclosed.
3. Voxel Accuracy and Its Effect on Analysis
Enscape Impact uses 35cm voxels to fill detected rooms and perform analysis. While this ensures efficient processing, it introduces a margin of error up to 35 cm. Rooms are simplified, and the analysis may not reflect every small detail.
Additionally, due to the minimum voxel size, not all enclosed spaces are detected as rooms. Spaces below 35 cm in any dimension (height, width, or depth) are ignored and merged with neighboring rooms. Additionally, shading elements are not detected during analysis.
4. Improving Room Detection Accuracy
To improve the accuracy of your analysis:
- Ground Modeling: Ensure that floors and ground planes are modeled correctly.
- Simplify Geometry:Hide unnecessary objects such as furniture, decorative elements, or assets that do not affect the analysis. Enscape assets are filtered by the algorithm, but hiding them manually can improve performance.
- Transparent Materials: Ensure windows use transparent materials, as the algorithm detects windows based on material transparency.
- Clean Geometry: Check that there are no large openings (>35-70 cm) in your rooms that might prevent them from being detected as enclosed spaces.
You can also analyze buildings separately to improve performance, as each building is treated independently.
5. Room Detection and Simulation Errors
Room detection is triggered every time Enscape Impact runs an analysis. It is also triggered when changes to the project are made. Simulation errors can occur if the geometry is too complex, incomplete, or if there are large gaps between room boundaries. If there is an issue with room detection, such as missing rooms or inaccurate results, check whether the geometry meets the room definition criteria. If you notice any issues, review your geometry and/or send the log files to our Support, so we can assist you in analyzing the issues.
7. Detecting Windows and Roofs
- Roofs: Roofs are automatically detected based on the upper boundaries of rooms with no geometry above them.
- Windows: The algorithm identifies windows based on their transparency. Transparent materials are detected as windows.
8. Tips for Faster and More Accurate Analysis
- Use Separate Views: Set up separate views in your CAD software for each building. Analyzing them individually improves performance and accuracy.
- Hide Non-Essential Elements: Hide elements that don’t affect energy performance, such as decorative objects or Enscape assets, to reduce calculation time.
Data Inputs Effect on Analysis
Location
If the project has a set location, Enscape Impact uses it. Longitude, latitude, and elevation are taken into consideration. Users can change the location in the Settings tab at any time. The selected location assigns the relevant Climate zone and an appropriate weather file. For more information on weather files, see the Simulation Weather Files in IESVE article.
The climate zones are defined using the ASHRAE Standard 169-2009. Similar zoning maps are defined for the whole world, so your project can be located anywhere.
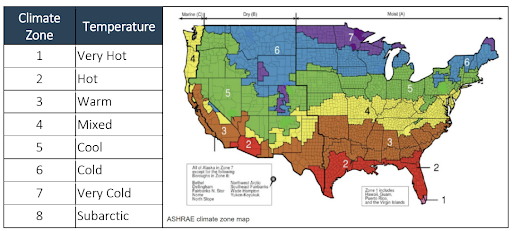
ASHRAE climate zone map
Building types
Building types in Enscape Impact are based on ASHRAE building types. The selected building type defines the relevant operational schedules, internal loads, and space conditions assigned to the model.
Enscape Impact offers the following building types:
Name | Description |
|---|
Name | Description | |
|---|---|---|
Dining | Buildings primarily designed for food preparation and dining, such as restaurants, cafes, and banquet halls. | Assembly Group A-2 |
Healthcare | Buildings designed for medical care and treatment, including hospitals, clinics, nursing homes, and similar facilities for patient care and recovery. | Institutional Group I-2 |
Hospitality | Buildings used for temporary accommodations, including hotels, motels, and boarding houses offering short-term accommodations for guests. | Residential Group R-1 |
Industrial | Buildings used for manufacturing and industrial processes, such as factories, workshops, and other facilities for producing or assembling goods. | Factory Group F |
Multifamily | Residential buildings designed for multiple-family units, such as apartment complexes, condominiums, and dormitories. | Residential Group R-2 |
Office | Buildings primarily used for business and administrative activities, including offices, co-working spaces, and corporate headquarters. | Business Group B |
Retail | Buildings used for commercial sales and trade, such as shops, supermarkets, and showrooms, where goods are displayed and sold to consumers. | Mercantile Group M |
Educational | Buildings designed for learning and teaching, including schools, universities, and training centers. | Educational Group E |
Single-Family | Individual residential buildings designed for single households, such as detached houses, townhouses, or duplexes. | Residential Group R-3 |
Sports | Buildings designed for indoor sports and recreation, including gyms, arenas, and swimming pools, accommodating spectators and events. | Assembly Group A-4 |
Transportation | Buildings designed for transportation and transit activities, such as airports, train stations, and bus terminals, where passengers congregate. | Assembly Group A-3 |
Warehouse | Buildings primarily used for storage and logistics, including distribution centers, stockrooms, and depots for goods or materials. | Storage Group S |
As only one type can be selected, select the main building type.
If the model includes several independent buildings with different main building types, they can be analyzed independently using different views.
Analyzing parts of a building independently based on function (e.g., the first floor is dining, the second floor is office) is not advisable. This causes the building envelope to have different performance readings, and the results will be inaccurate.
Building and renovation years
The Building age ranges are defined based on the available ASHRAE Standards editions. The following are used:
The appropriate standard is applied based on the building type and standard revisions, as it applies to buildings built after its issue date. ASHRAE 90.1 applies to all buildings except low-rise residential buildings. ASHRAE 90.2 applies only to low-rise residential buildings.
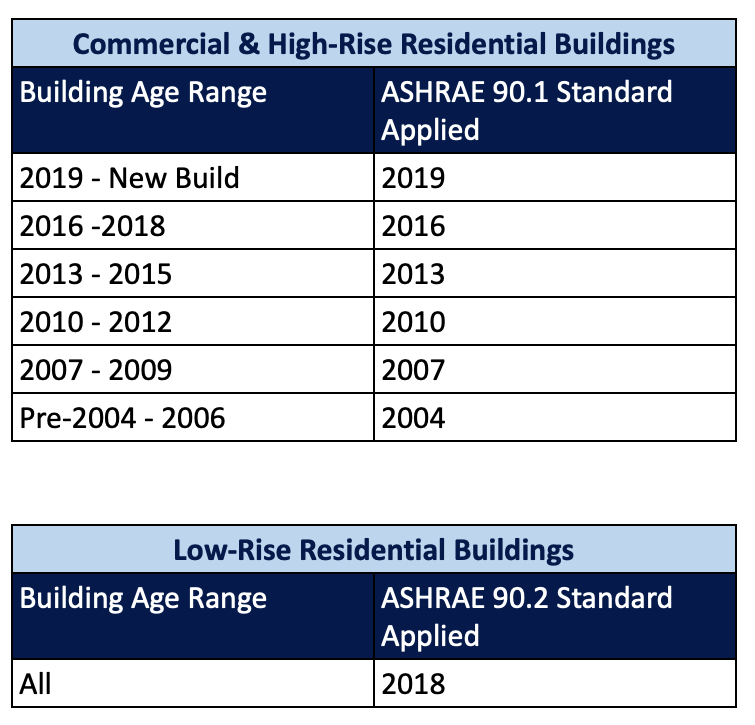
ASHRAE building age ranges
Default Datasets
Based on the inputs, default datasets are assigned. The model is layered with thermal properties and system information tailored to the location, age, and building type. IES derives the datasets to configure the buildings from the following ASHRAE Standards & User Manuals:
- Energy Standard for Buildings Except Low-Rise Residential Buildings. Versions:
- ASHRAE 90.1:2019
- ASHRAE 90.1:2016
- ASHRAE 90.1:2013
- ASHRAE 90.1:2010
- ASHRAE 90.1:2007
- ASHRAE 90.1:2004
- Energy Standard for Buildings: Low-Rise Residential Buildings Version: ASHRAE 90.2:2018
- Ventilation for Acceptable Indoor Air Quality. Version: ASHRAE 62.1:2016
- Climatic Data for Building Design Standards. Version: ASHRAE Standard 169-2013
Default Datasets Content
System types | Characteristic | Definition | Example | Dependant on |
|---|
System types | Characteristic | Definition | Example | Dependant on |
|---|---|---|---|---|
Heating system | Heating Operation Profile | Defines the operational schedule for heating availability within a building. | The On continuously status indicates the heating system is always operational, regardless of external conditions or time of day. Suitable for hospitals or data centers. | Building type, Building year |
Heating Setpoint | Defines the target indoor temperature that the heating system aims to maintain during occupied hours. | In an office building, a setpoint of 21.1°C ensures a comfortable working environment for occupants while balancing energy efficiency and operational requirements. | ||
Heating Plant Profile | Defines the schedule and operational pattern of the heating system, including auxiliary energy consumption, based on time variations. | In an office building, the system operates during working hours and reduces energy use during unoccupied periods. | ||
Heating Plant Radiant Fraction | Defines the proportion of heat emitted by the heating system as radiant energy. | Forced warm-air heaters have a radiant fraction of 0.0, while high-temperature radiant heaters may have a fraction of 0.9, reflecting their focus on radiant heat output. | ||
Cooling system | Cooling Operation Profile | Defines the operational schedule for cooling availability within a building. | The On-Continuously status indicates the cooling system is always available, regardless of external conditions or time of day. Suitable for data centers or high-occupancy offices. | Building type, Building year, Location |
Cooling Setpoint | Defines the target indoor temperature that the cooling system aims to maintain during occupied hours. | In an office building, a setpoint of 23.9°C ensures a comfortable working environment for occupants while balancing energy efficiency and operational requirements. | ||
Cooling Plant Profile | Defines the schedule and operational pattern of the cooling system, including auxiliary energy consumption, based on time variations. | In an office building, it aligns with a building’s occupancy schedule, ensuring the system operates efficiently during working hours and reduces energy use during unoccupied periods. | ||
Cooling Plant Radiant Fraction | Defines the proportion of cooling delivered as radiant energy by the cooling system. | A fraction of 0.00 is typical for air-based systems where all cooling is delivered via convective airflow, as opposed to systems like chilled beams, which may have a higher radiant fraction. | ||
Auxiliary Ventilation System | Auxiliary Ventilation System | Defines the auxiliary ventilation system associated with the Apache System methodology. It specifies the type of system used to condition and supply additional ventilation to a room. | A system supplying eight liters per second per person of fresh air ensures adequate indoor air quality in a densely occupied office. | Building type, Building year |
Domestic Hot Water System (DWH) | Hot Water Consumption | Defines the rate of hot water usage in a building, measured in liters per hour per person (l/h.p), based on the Pattern of Use. This value represents the estimated demand for domestic hot water and is critical for calculating energy requirements for water-heating systems. | In an office, the rate is 0.170 l/(h.p) for handwashing and occasional cleaning. In residential buildings, it might be higher, such as 0.350 l/(h.p) due to showers and cooking. | Building type, Building year |
Hot Water Consumption Pattern | Defines the schedule of hot water consumption based on building occupancy patterns.This pattern helps model water-heating demands during different periods of the day, reflecting real-world usage scenarios. | In an office building, the pattern shows increased demand from 8 AM to 6 PM. In residential settings, it peaks in the morning and evening when occupants use water for showers or cooking. | ||
Lighting | Sensible Gain | Defines the energy added to a space due to lighting, expressed as heat gain per square meter of floor area. This value represents the amount of heat generated by lighting systems, which contributes to the internal heat load of a building. It is used in calculating the Internal Gains for energy performance analysis. | A value of 12.0 W/m² indicates a high lighting intensity, typical for retail stores. In residential spaces, the value may be lower, such as 5.0 W/m². | Building type, Building year |
Variation Profile | Defines how lighting usage varies over time, influencing the heat gains attributed to lighting within a building. This profile accounts for lighting intensity changes during different periods, such as occupied and unoccupied hours, and is applied to calculate the Internal Gains. | In an office, lights are fully operational from 8 AM to 6 PM with no reductions for lunch breaks. In a residential setting, lighting may be used more in the evening, from 5 PM to 11 PM. | ||
Occupancy | Occupancy Density | Defines the number of occupants per unit area, affecting internal gains and energy loads from human activity. This value helps calculate internal gains and energy loads due to human activity. | In an office building, occupancy density, example: 9 – 12 m2/p | Building type, Building year |
Sensible Gain | Defines the heat generated by occupants through conduction, convection, and radiation, contributing to the internal heat gains of a building. | Each office occupant generates 73W of sensible heat during working hours, affecting cooling needs. In a gym, this may increase to 120 W/person. | ||
Latent Gain | Defines the energy introduced into a space by moisture emitted by occupants through respiration and perspiration, which affects humidity and cooling. | Each office occupant generates 58W of latent heat, impacting the humidity levels and cooling load. In a gym, it might increase to 120 W/person. | ||
Variation Profile | Defines the schedule for changes in occupancy levels throughout the day. | In an office, the profile is 8 AM to 6 PM with no reduction for lunch breaks. For residential settings, the profile may show increased occupancy in the evening. | ||
Equipment Loads | Sensible Gain | Defines the energy added to a space in the form of heat transferred by conduction, convection, or radiation from equipment operations. Sensible gains are a key factor in internal gains calculations, directly impacting temperature control and HVAC system sizing. | In an office building, equipment such as computers, printers, and lighting may contribute around 10.8 W/m² to the total sensible gain. | Building type, Building year |
Latent Gain | Defines the energy added to a space in the form of moisture introduced by equipment or processes. This moisture may come from vapor released by equipment operations, specific industrial processes, or air infiltration from external or adjacent spaces. Latent gains are a component of internal gains calculations, accounting for humidity control and HVAC system performance. | In an office building, latent gains are minimal, around 0.000 W/m², but in industrial settings, they could be significant. | ||
Variation Profile | Defines the time-dependent variation in equipment energy use throughout the day, reflecting operational schedules or usage patterns. | In an office, equipment operates continuously from 8 AM to 6 PM, aligning with typical office hours. In residential or industrial settings, equipment use may vary more. | ||
Infiltration | Max Flow | Defines the maximum air infiltration rate, measured in air changes per hour (ACH), indicating the air volume replaced per hour due to gaps or cracks. | A well-sealed office building may have a max flow of 0.167 ACH, while a poorly insulated building might have a max flow of 1.0 ACH. | Building type, Building year |
Variation Profile | Defines the time-based pattern of air infiltration, impacting ventilation calculations. | “On continuously” indicates infiltration occurs at a constant rate throughout the day, typical of older buildings or those without controlled ventilation. | ||
Components Thermal Transmittance (External Wall, Ground floor, Roof, Windows/Glazing, Rooflights, Door) | U-value | Defines the rate of heat transfer through building envelope components, such as walls, floors, and windows, indicating insulation quality. | A U-value of 0.1 W/m²K indicates excellent insulation, while a value of 1.0 W/m²K indicates poor insulation. (This example is for Opaque constructions) | Building type, Location, Building year |
Model Calculations
Based on all inputs for the energy model, calculations are performed with IES’s APACHE engine. The APACHE engine is fully adherent to international standards. APACHE engine considers a complete virtual representation of the real building using first-principles models of heat transfer processes and is driven by recorded or future-predicted weather data. Calculations consider the exact location of solar penetration and the associated solar gain throughout the building, and pressure network calculations assess both natural ventilation and forced air movement. Calculating size and selecting air- and waterside HVAC systems, APACHE provides a complete understanding of energy and carbon usage prediction for both the building and its equipment. For more information on the used methodologies, see the IES Software Validation page.
Benchmarking Data
Benchmarking data is added to present results in a more user-friendly way. Benchmarks for each building type have been generated based on the CBECS & RECS databases for North America, as defined and shared by the U.S. Energy Information Administration (EIA).
Benchmarking data for buildings in the United Kingdom and the Republic of Ireland has been derived by IES to provide location-specific benchmark assessment.
IES utilized the following databases:
- DECC data, measured in 2017
- CIBSE magazine measured data case studies 2017
- UK Public Authority published measured data in 2017
IES created quartile ranges for benchmarking. Quartiles are cut points that divide the range of a probability distribution into continuous intervals with four equal probabilities (as in one-fourth) of the spectrum.
Benchmarking quartiles are climate-reactive. They align ASHRAE building types with CBECS & RECS databases for North America. For the United Kingdom and Ireland, they align ASHRAE building types with DECC, CIBSE, and UK Public Authority data. Here is the mapping of building types for each set:
- Single-family – RECS Single Families Detached
- Multiple-family – RECS Multi Family Large
- Office – CBECS Office
- School or University – CBECS Education
- Hospital – CBECS Inpatient Healthcare
- Dining – CBECS Food Service
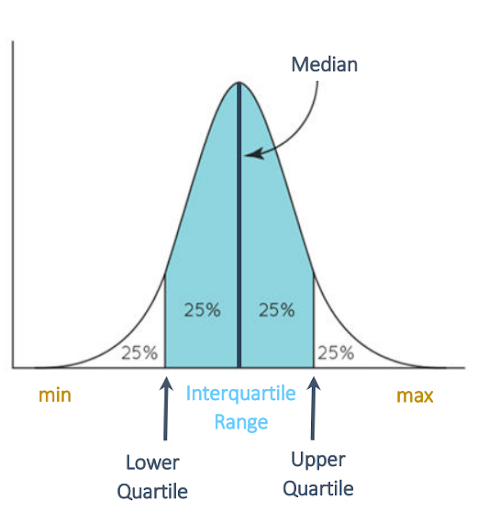
Quartile ranges
Results
The accuracy of the results is based on how closely the default datasets match the actual design. Here are the key insights provided by Enscape Impact:
1. Peak Energy Demands
Definition: Peak load is the energy consumption of the building during the most severe weather conditions, whether extreme heat or cold. This load is used to determine the size and capacity of the HVAC systems.
- Included: Peak load calculations consist of the highest demand for heating or cooling throughout the year. It does not include energy consumption for electricity, hot water, or internal gains like lighting and appliances.
- Calculation: Peak energy demands are determined based on weather conditions from the selected location’s weather file and standards specified by ASHRAE. Only extreme or ‘design conditions’ are considered, so it doesn’t simulate the entire year.
- Purpose: Peak energy demands help establish the size of systems like HVAC to ensure that they can meet the building’s maximum energy demands.
- Exclusions: Peak energy demands do not include internal gains, solar gains, electricity, or hot water energy.
2. Carbon Emissions
Definition: Carbon emissions represent the total annual carbon output from building operations.
- Included: The sum of emissions generated from the building’s operational needs, specifically heating, cooling, lighting, and electricity. This includes emissions from gas, oil, and electricity used to operate the building.
- Calculation: Based on the energy end-use data, the results reflect the annual emissions caused by operational energy demand. This includes emissions from fossil fuels and electricity, depending on the energy source mix.
3. Energy Use Intensity (EUI)
Definition: EUI is the building’s total energy consumption per year divided by its floor area, representing its overall energy efficiency.
- Included: EUI includes all forms of energy used during the building’s operation (gas, oil, and electricity).
- Calculation: The total energy consumed for heating, cooling, lighting, and other operational needs is divided by the building’s total floor area. This is then expressed as energy per square meter or square foot.
4. Energy End Use
Definition: Energy end-use breaks down the total energy consumption by category, showing how much energy is used for cooling, heating, hot water, lighting, and other electricity needs.
- Included: Energy distribution is shown between key categories, including heating, cooling, hot water, lighting, and other electrical demands.
- Calculation: The energy end-use results are derived based on default datasets and the selected building and weather conditions, allowing users to see how energy is allocated among different systems.
Improving building design using Enscape Impact
Peak Energy Demands
Reducing the peak load of a building during the early design stage can significantly enhance its energy efficiency, reduce operational costs, and improve occupant comfort. The lower the value, the better. Here are some strategies and design considerations to help achieve this in early design stages:
Optimize Building Orientation and Layout
- Orientation: Orient the building to maximize natural daylight and reduce solar heat gain, especially in hot climates. South-facing windows (in the Northern Hemisphere) can provide beneficial winter solar gain.
- Zoning: Design internal spaces to create thermal zones based on usage patterns, enabling more efficient heating and cooling control.
Enhance Daylighting and Shading
- Day lighting: Use skylights, light shelves, and clerestory windows to enhance natural light distribution, reducing the need for artificial lighting.
- Shading Devices: Incorporate external shading devices (e.g., overhangs, louvers) and internal shading (e.g., blinds, curtains) to control solar heat gain and glare.
Renewable Energy Integration (not included in this version of Enscape Impact)
- Solar Panels: Incorporate solar photovoltaic (PV) panels to generate on-site renewable energy, reducing dependency on external power sources.
- Solar Thermal: Use solar thermal systems for water heating to reduce the load on conventional water heaters.
Landscaping and Site Design
- Vegetation: Use landscaping to provide natural shading and windbreaks, which can reduce heating and cooling loads.
- Green Roofs: Install green roofs to provide additional insulation and reduce the urban heat island effect.
Carbon emissions
Reducing operational carbon emissions is a key goal in sustainable building design, and one of the most effective ways to achieve this is to target areas where energy consumption is highest.
Reducing Carbon Emissions through Peak Load and Energy End Use Improvements:
- Peak Energy Demands: Reducing the building’s peak heating and cooling loads can significantly reduce the overall energy consumption during periods of maximum demand. By minimizing these peaks, the systems in place, like HVAC, can operate more efficiently, leading to lower carbon emissions. See the Peak Energy Demands section to explore ways to manage heating and cooling requirements during extreme weather conditions.
- Energy End Use: Understanding the breakdown of energy usage (heating, cooling, lighting, hot water, etc.) enables targeted efficiency measures. This helps reduce energy demand in specific areas. Lowering overall energy consumption directly reduces carbon emissions. Refer to the Energy End Use section to discover how analyzing energy distribution can help you identify areas for improvement.
Energy Use Intensity
The EUI measures the total energy consumption per square meter or square foot of building space, and the result is displayed on a color-coded dial for easy interpretation.
Red Dial – The building’s EUI is among the 71-100% of the benchmarked buildings, indicating a high energy use compared to similar buildings.
Yellow Dial – The building’s EUI is among the 31-70% of the benchmarked buildings, reflecting average energy use.
Green Dial – The building’s EUI is among the 0-30% of the benchmarked buildings, showcasing high energy efficiency.
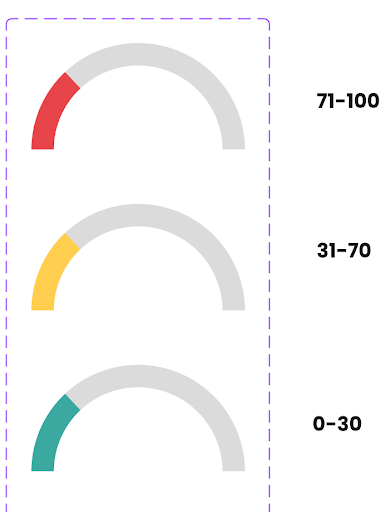
Color Codes
Performance map visualizations
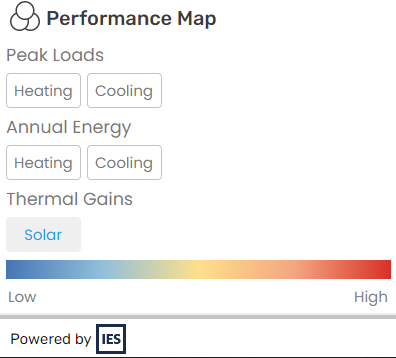
The Performance Map visualizes the performance of each room in terms of peak loads, heating, cooling, and solar gains. Performance is calculated individually for every room, and the rooms with the lowest and highest values form the scale. This means that rooms with very close performance values can still appear dramatically different in color (e.g., blue vs. red), as they set the boundaries for the color range. It’s important to check the scale values for precise interpretation.
This is helpful to spot rooms that may require design improvements. By identifying problematic rooms, targeted measures can be implemented.
The Performance Map visualization tool is a quick, intuitive way to analyze and optimize the building’s design for better performance.
Performance Map